So now I’m hooked on Docker containers and I put together a Docker container stack with Eclipse Mosquitto, Node-RED, I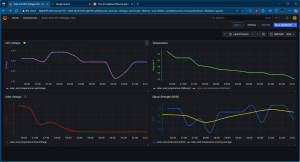 nfluxDB, and Grafana. Grafana is pretty fricking amazing. I was displaying EVERYTHING on Node-RED dashboard, but now most of it is in Grafana. I’m still trying to figure out how to effectively display wind direction and speed. Also rain totals…and we’ve had a LOT of it recently in the Pacific NW! Lot of flooding! This pic of of my Grafana weather dashboard is an older one. Will post a more up to date one soon.